- 博客/
高可用prometheus监控集群搭建(二)
高可用prometheus监控集群部署 - This article is part of a series.
Prometheus使用exporter工具来暴露主机和应用程序上的指标,目前有很多可用于各种目的的exporter( https://prometheus.io/docs/instrumenting/exporters/)
Node Exporter部署#
Node exporter可提供用于收集各种主机指标数据(包括CPU、内存、网络和磁盘),在k8s集群中可以使用daemonset的方式部署。需要将宿主机根映射到容器中,来正确获取主机文件系统监控数据
$ cat node-exporter.yaml
apiVersion: extensions/v1beta1
kind: DaemonSet
metadata:
  name: node-exporter
  namespace: kube-system
  labels:
    k8s-app: node-exporter
spec:
  template:
    metadata:
      labels:
        k8s-app: node-exporter
    spec:
      tolerations:
        - effect: NoSchedule
          key: node-role.kubernetes.io/master
      containers:
      - image: k8s.gcr.io/prom/node-exporter:latest
        imagePullPolicy: IfNotPresent
        name: prometheus-node-exporter
        ports:
        - containerPort: 9100
          hostPort: 9100
          protocol: TCP
          name: metrics
        volumeMounts:
        - mountPath: /host/proc
          name: proc
        - mountPath: /host/sys
          name: sys
        - mountPath: /host
          name: rootfs
        args:
        - --path.procfs=/host/proc
        - --path.sysfs=/host/sys
        - --path.rootfs=/host
      volumes:
        - name: proc
          hostPath:
            path: /proc
        - name: sys
          hostPath:
            path: /sys
        - name: rootfs
          hostPath:
            path: /
      hostNetwork: true
      hostPID: true
---
apiVersion: v1
kind: Service
metadata:
  annotations:
    prometheus.io/scrape: "true"
  labels:
    k8s-app: node-exporter
  name: node-exporter
  namespace: kube-system
spec:
  ports:
  - name: http
    port: 9100
    protocol: TCP
  selector:
    k8s-app: node-exporter
$ kubectl apply -f node-exporter.yaml
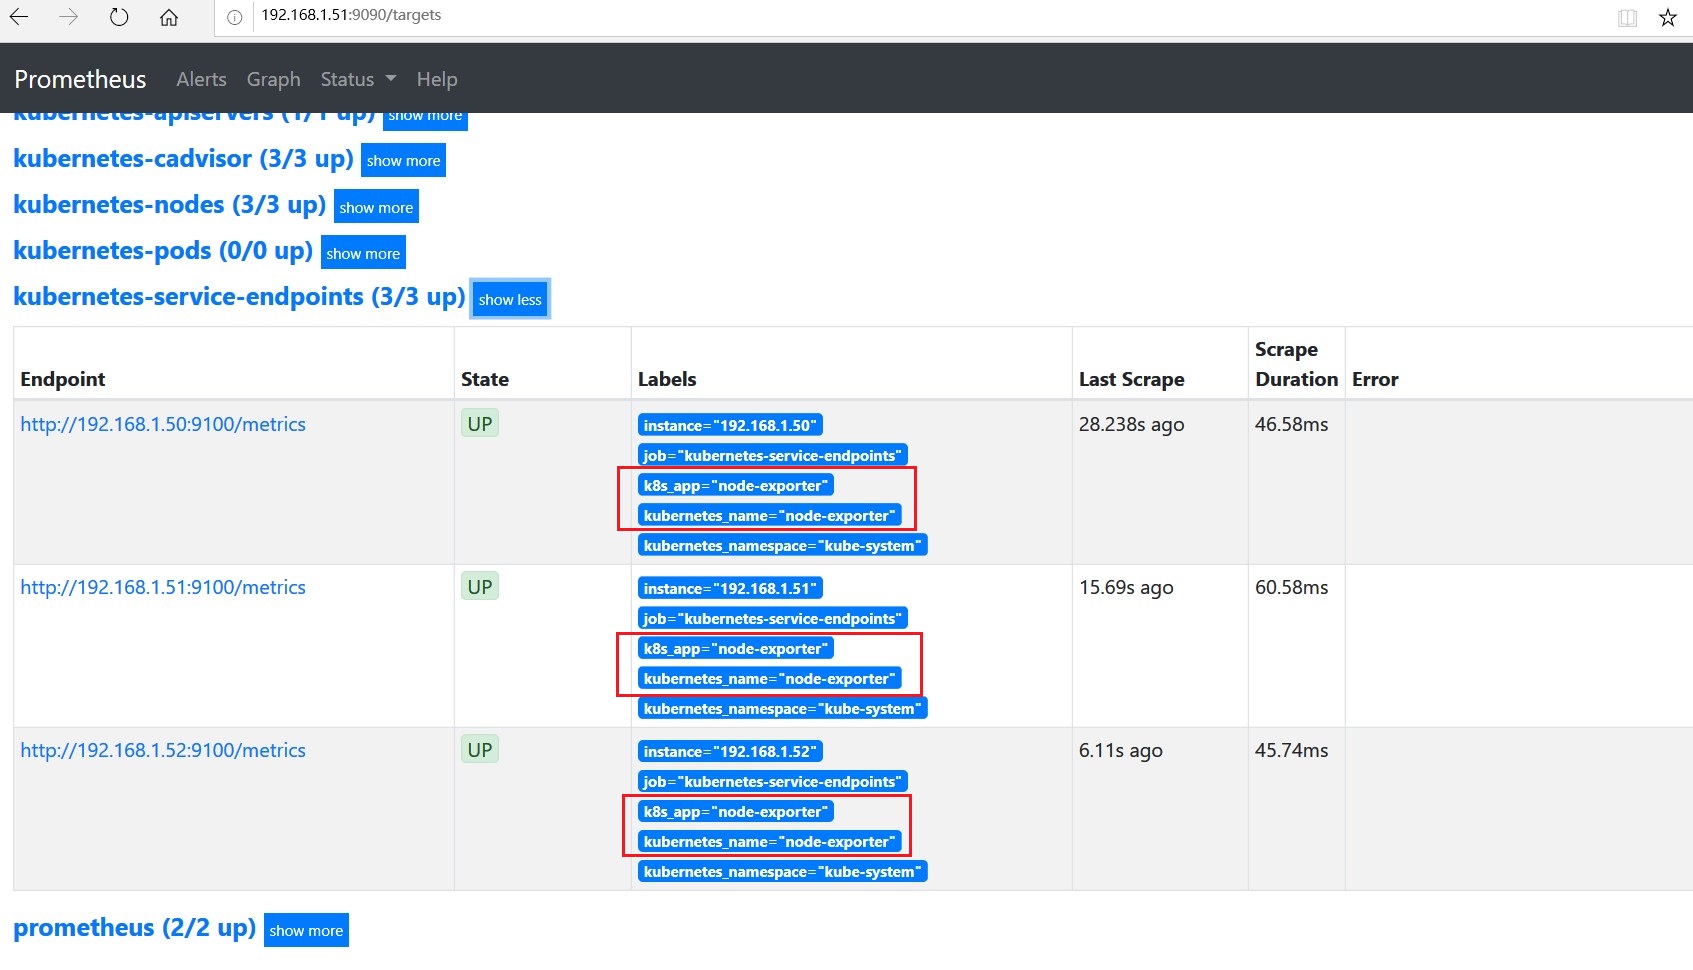
node-exporter的service中指定了annotation: prometheus.io/scrape: "true", job:kubernetes-service-endpoints可以自动发现,如下图所示
访问graph查询页面,可以看到node_开头的metrics也已经获取到
kube-state-metrics部署#
cAdvisor(kubelet)可以收集容器及systemd托管服务的CPU、内存、网络、容器数量,却不能获取到有关kubennetes资源对象指标的信息,比如:集群运行了多少个POD,分别是什么状态,pod重启了多少次,pod中的容器启动失败的原因是什么,deployment的部署是否成功,deployment的运行副本数是否和元数据中的一致
kube-state-metrics通过轮询kubernetes API,提供有关资源对象指标的metrics,包括:CronJob、DaemonSet、Deployment、Job、LimitRange、Node、PersistentVolume 、PersistentVolumeClaim、Pod、Pod Disruption Budget、ReplicaSet、ReplicationController、ResourceQuota、Service、StatefulSet、Namespace、Horizontal Pod Autoscaler、Endpoint、Secret、ConfigMap、Ingress、CertificateSigningRequest
rbac资源初始化#
$ cat kube-state-metrics-rbac.yaml
kind: Role
metadata:
  namespace: kube-system
  name: kube-state-metrics-resizer
rules:
- apiGroups: [""]
  resources:
  - pods
  verbs: ["get"]
- apiGroups: ["apps"]
  resources:
  - deployments
  resourceNames: ["kube-state-metrics"]
  verbs: ["get", "update"]
- apiGroups: ["extensions"]
  resources:
  - deployments
  resourceNames: ["kube-state-metrics"]
  verbs: ["get", "update"]
---
kind: RoleBinding
metadata:
  name: kube-state-metrics
  namespace: kube-system
roleRef:
  apiGroup: rbac.authorization.k8s.io
  kind: Role
  name: kube-state-metrics-resizer
subjects:
- kind: ServiceAccount
  name: kube-state-metrics
  namespace: kube-system
---
kind: ClusterRole
metadata:
  name: kube-state-metrics
rules:
- apiGroups: [""]
  resources:
  - configmaps
  - secrets
  - nodes
  - pods
  - services
  - resourcequotas
  - replicationcontrollers
  - limitranges
  - persistentvolumeclaims
  - persistentvolumes
  - namespaces
  - endpoints
  verbs: ["list", "watch"]
- apiGroups: ["extensions"]
  resources:
  - daemonsets
  - deployments
  - replicasets
  - ingresses
  verbs: ["list", "watch"]
- apiGroups: ["apps"]
  resources:
  - daemonsets
  - deployments
  - replicasets
  - statefulsets
  verbs: ["list", "watch"]
- apiGroups: ["batch"]
  resources:
  - cronjobs
  - jobs
  verbs: ["list", "watch"]
- apiGroups: ["autoscaling"]
  resources:
  - horizontalpodautoscalers
  verbs: ["list", "watch"]
- apiGroups: ["policy"]
  resources:
  - poddisruptionbudgets
  verbs: ["list", "watch"]
- apiGroups: ["certificates.k8s.io"]
  resources:
  - certificatesigningrequests
  verbs: ["list", "watch"]
---
kind: ClusterRoleBinding
metadata:
  name: kube-state-metrics
roleRef:
  apiGroup: rbac.authorization.k8s.io
  kind: ClusterRole
  name: kube-state-metrics
subjects:
- kind: ServiceAccount
  name: kube-state-metrics
  namespace: kube-system
---
apiVersion: v1
kind: ServiceAccount
metadata:
  name: kube-state-metrics
  namespace: kube-system
创建deployment#
$ cat kube-state-metrics-deployment.yaml
kind: Deployment
metadata:
  name: kube-state-metrics
  namespace: kube-system
spec:
  selector:
    matchLabels:
      k8s-app: kube-state-metrics
  replicas: 1
  template:
    metadata:
      labels:
        k8s-app: kube-state-metrics
    spec:
      serviceAccountName: kube-state-metrics
      containers:
      - name: kube-state-metrics
        image: quay.io/coreos/kube-state-metrics:v1.6.0
        ports:
        - name: http-metrics
          containerPort: 8080
        - name: telemetry
          containerPort: 8081
        readinessProbe:
          httpGet:
            path: /healthz
            port: 8080
          initialDelaySeconds: 5
          timeoutSeconds: 5
      - name: addon-resizer
        image: k8s.gcr.io/addon-resizer:1.8.4
        resources:
          limits:
            cpu: 150m
            memory: 50Mi
          requests:
            cpu: 150m
            memory: 50Mi
        env:
          - name: MY_POD_NAME
            valueFrom:
              fieldRef:
                fieldPath: metadata.name
          - name: MY_POD_NAMESPACE
            valueFrom:
              fieldRef:
                fieldPath: metadata.namespace
        command:
          - /pod_nanny
          - --container=kube-state-metrics
          - --cpu=100m
          - --extra-cpu=1m
          - --memory=100Mi
          - --extra-memory=2Mi
          - --threshold=5
          - --deployment=kube-state-metrics
---
apiVersion: v1
kind: Service
metadata:
  name: kube-state-metrics
  namespace: kube-system
  labels:
    k8s-app: kube-state-metrics
  annotations:
    prometheus.io/scrape: 'true'
spec:
  ports:
  - name: http-metrics
    port: 8080
    targetPort: http-metrics
    protocol: TCP
  - name: telemetry
    port: 8081
    targetPort: telemetry
    protocol: TCP
  selector:
    k8s-app: kube-state-metrics
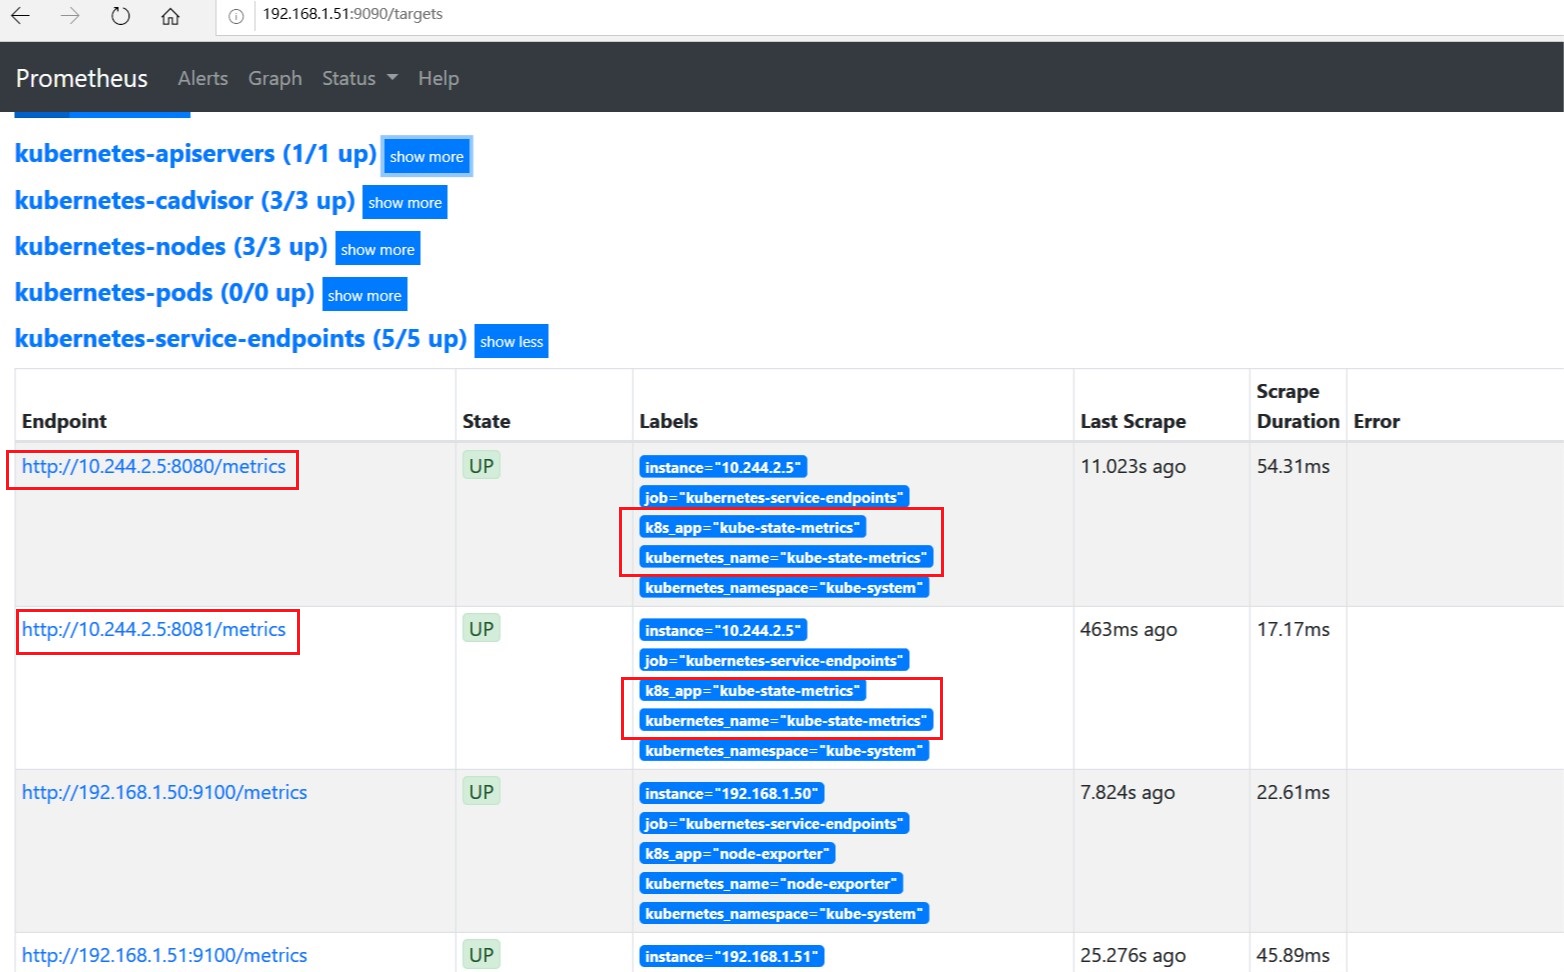
kube-state-metrics的service中指定了annotation: prometheus.io/scrape: "true", job: kubernetes-service-endpoints可以自动发现